Sunday, May 31, 2009

Floating Palettes in LabVIEW

LabVIEW has three often-used floating palettes that you can place in a convenient spot on your screen: the Tools palette, the Controls palette, and the Functions palette. You can move them around by clicking on their title bar and dragging. Close them just like you would close any window in your operating system. If you decide you want them back, select the palette you want from the View menufor example, View>>Tools Palette opens the Tools palette.

Controls and Functions Palettes

You will be using the Controls palette a lot, because that's where you select the controls and indicators that you want on your front panel. You will probably use the Functions palette even more often, because it contains the functions and structures used to build a VI.

The Controls and Functions palettes are unique in several ways. Most importantly, the Controls palette is only visible when the front panel window is active, and the Functions palette is only visible when the block diagram window is active. Both palettes have subpalettes containing the objects you need to access. As you pass the cursor over each subpalette button in the Controls and Functions palettes, you will notice that the subpalette's name appears in a tip strip beneath the mouse pointer (see Figure 40).
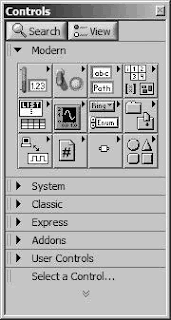


Figure 40. Controls palette


To select an object in the subpalette, click the mouse button over the object, and then click on the front panel or block diagram to place it where you want it.

Palette Item Categories

At the top level of the palettes are several "Categories," such as Modern, System, Classic, Express, Addons, Favorites, and others. You can expand and close these categories, by clicking on them, to navigate the tree of items and subcategories that are available within the palette.

One great category is Favorites (this is only present on the Functions palette, not the Controls palette). You can use this to group together items that you access frequently. When you find a function, structure, VI, or subpalette that you really like, right-click on the object and select Add Item to Favorites from the shortcut menu. This will add the object to the Favorites category, for quick and easy access.

Showing and Hiding Palette Categories

You can choose which categories you want to appear on the Controls or Functions palettes by pressing the View button and then selecting categories from the Always Visible Categories submenu. If you want all of the categories to be visible, select the Show All Categories option from the Always Visible Categories submenu (see Figure 41).
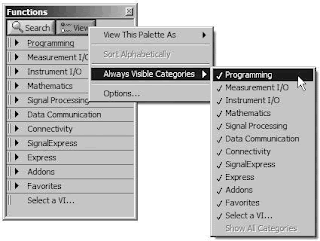


Figure 41. The Always Visible Categories
submenu of the palette View button


If a category is not selected in the Always Visible Categories, then you will not normally see it in the palette. However, you can temporarily display all of the categories by clicking on the double "down" arrows at the very bottom of the palette, as shown in Figure 42. You can hide those categories again by clicking on the double "up" arrows at the very bottom of the palette, as shown in Figure 43.
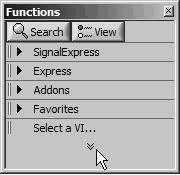


Figure 42. Functions palette with only
the "always visible" categories visible
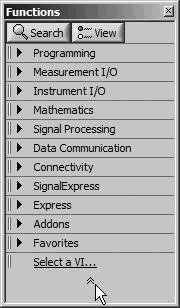


Figure 43. Functions palette with all categories visible


Reordering Palette Categories

You can reorder the palette categories by right-clicking on them and choosing Move this Category Up, Move this Category Down, or Move to Top (Expand by Default). Additionally, you can drag and drop the categories within the list by clicking on the two vertical grab-bars (||) to the left of the category text.

Palette View Formats

The way that you navigate the palettes can be changed by choosing a different palette View Format. Pressing the View button at the top of a palette will open a menu. In the View This Palette As submenu, you can choose from six different View Formats, as shown in Figure 44.
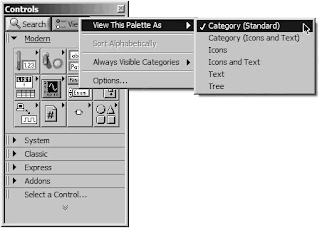


Figure 44. The View This Palette As submenu
of the palette View button menu showing the
currently selected checked palette view format


Category (Standard) is the default View Format, and the one shown throughout this tutorial.

Category (Icons and Text), shown in Figure 45, is similar to Category (Standard), except that each item's name appears directly beneath its icon.
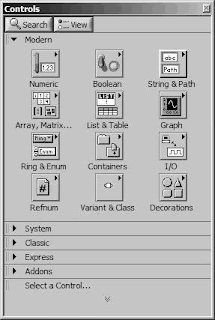


Figure 45. "Category (Icons and Text)" palette view format

Icons, shown in Figure 46, is the format that most are familiar with from previous versions of LabVIEW. Each subpalette and item is represented by an icon. When you mouse-over an item, its name appears at the top of the palette.
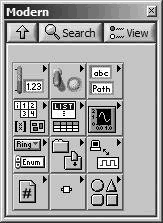


Figure 46. "Icons" palette view format

Icons and Text, shown in Figure 47, is similar to Icons, except that each item's name appears directly beneath its icon.
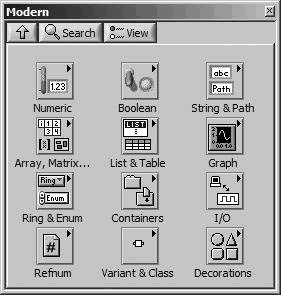


Figure 47. "Icons and Text" palette view format


Text, shown in Figure 48, is minimal. It behaves like the Icons and Icons and Text formats, where clicking on a subpalette navigates down into that subpalette. Subpalettes are represented by folders with names, and items are represented by their name.
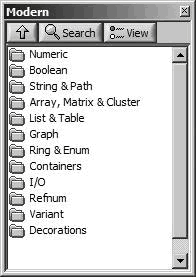


Figure 48. "Text" palette view format

Tree, shown in Figure 49, is also minimal, having only folder icons and item names. However, it behaves more like the Category formats, having a tree hierarchy.
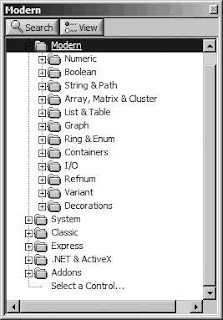


Figure 49. "Tree" palette view format

The "Icons," "Icons and Text," and "Text" palette view formats all have an "up" button (see Figure 50), which, when pressed, returns you to the previous ("owning") palettesince these view formats are not a tree view. You can search for a specific item in a palette by clicking on the spyglass icon (see Figure 50).
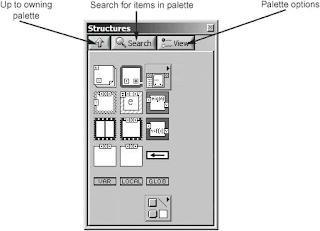


Figure 50. The buttons at the top of each palette are used for navigation and configuration options.

There is another way to navigate palettes that some people find a little easier. Instead of each subpalette replacing the current palette, you can pass through subpalettes in a hierarchical manner without them replacing their parent palettes. You can do this by right-clicking (Windows) or control-clicking (Mac OS X) the subpalette icons (see Figure 51).
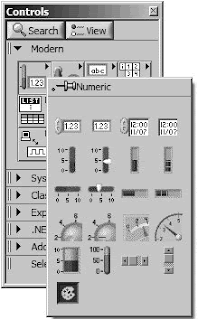


Figure 51. A floating subpalette created by right-clicking on a subpalette icon

Note that some subpalettes have subpalettes containing more objects; these are denoted by a little triangle in the upper-right corner of the icon and a raised appearance (see Figure 52). We'll discuss specific subpalettes and their objects in the next chapter.
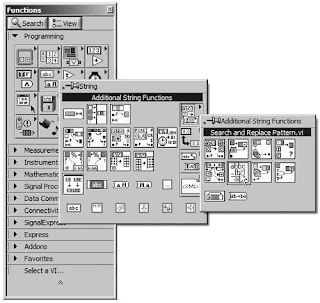


Figure 52. Functions palette with two levels of floating subpalettes visible

Thursday, May 28, 2009

Comparison of the terms SCADA, DCS, PLC and smart instrument

A. Scada System

A SCADA (or supervisory control and data acquisition) system means a system consisting of a number of remote terminal units (or RTUs) collecting field data connected back to a master station via a communications system. The master station displays the acquired data and also allows the operator to perform remote control tasks. The accurate and timely data (normally real-time) allows for optimization of the operation of the plant and process. A further benefit is more efficient, reliable and most importantly, safer operations. This all results in a lower cost of operation compared to earlier non-automated systems.

There is a fair degree of confusion between the definition of SCADA systems and process control system. SCADA has the connotation of remote or distant operation. The inevitable question is how far ‘remote’ is – typically this means over a distance such that the distance between the controlling location and the controlled location is such that direct-wire control is impractical (i.e. a communication link is a critical component of the system).

A successful SCADA installation depends on utilizing proven and reliable technology, with adequate and comprehensive training of all personnel in the operation of the system. There is a history of unsuccessful SCADA systems – contributing factors to these systems includes inadequate integration of the various components of the system, unnecessary complexity in the system, unreliable hardware and unproven software. Today hardware reliability is less of a problem, but the increasing software complexity is producing new challenges. It should be noted in passing that many operators judge a SCADA system not only by the smooth performance of the RTUs, communication links and the master station (all falling under the umbrella of SCADA system) but also the field devices (both transducers and control devices). The field devices however fall outside the scope of SCADA in this manual and will not be discussed further. A diagram of a typical SCADA system is given opposite.


On a more complex SCADA system there are essentially five levels or hierarchies:
• Field level instrumentation and control devices
• Marshalling terminals and RTUs
• Communications system
• The master station(s)
• The commercial data processing department computer system
The RTU provides an interface to the field analog and digital signals situated at each
remote site.
The communications system provides the pathway for communications between the
master station and the remote sites. This communication system can be radio, telephone line, microwave and possibly even satellite. Specific protocols and error detection philosophies are used for efficient and optimum transfer of data. The master station (and submasters) gather data from the various RTUs and generally provide an operator interface for display of information and control of the remote sites. In large telemetry systems, submaster sites gather information from remote sites and act as a relay back to the control master station.

SCADA technology has existed since the early sixties and there are now two other competing approaches possible – distributed control system (DCS) and programmable logic controller (PLC). In addition there has been a growing trend to use smart instruments as a key component in all these systems. Of course, in the real world, the designer will mix and match the four approaches to produce an effective system matching his/her application.


B. Distributed control system (DCS)

In a DCS, the data acquisition and control functions are performed by a number of distributed microprocessor-based units situated near to the devices being controlled or the instrument from which data is being gathered. DCS systems have evolved into systems providing very sophisticated analog (e.g. loop) control capability. A closely integrated set of operator interfaces (or man machine interfaces) is provided to allow for easy system configurations and operator control. The data highway is normally capable of fairly high speeds (typically 1 Mbps up to 10 Mbps).


C. Programmable logic controller (PLC)

Since the late 1970s, PLCs have replaced hardwired relays with a combination of ladder–logic software and solid state electronic input and output modules. They are often used in the implementation of a SCADA RTU as they offer a standard hardware solution, which is very economically priced.


Another device that should be mentioned for completeness is the smart instrument which both PLCs and DCS systems can interface to.

D. Smart instrument

Although this term is sometimes misused, it typically means an intelligent (microprocessor based) digital measuring sensor (such as a flow meter) with digital data communications provided to some diagnostic panel or computer based system.


This tutorial will henceforth consider DCS, PLC and smart instruments as variations or components of the basic SCADA concept.

Monday, May 25, 2009

Programming 8-bit PIC Microcontrollers in C: with Interactive Hardware Simulation

Step-by-step, practical instruction on how to program PICs in C, with no prior experience necessary!

Product Description
PIC Microcontrollers are present in almost every new electronic application that is released from garage door openers to the iPhone. With the proliferation of this product more and more engineers and engineers-to-be (students) need to understand how to design, develop, and build with them. Martin Bates, best-selling author, has provided a step-by-step guide to programming these microcontrollers (MCUs) with the C programming language.

With no previous knowledge of C necessary to read this book, it is the perfect for entry into this world for engineers who have not worked with PICs, new professionals, students, and hobbyists. As MCUs become more complex C is the most popular language due to its ability to process advanced processes and multitasking. RTOSs, that is a need to know for engineers, is also discussed as more advanced MCUs require timing and organization of programming and implementation of multitasking. The book includes lots of source code, circuit schematics, and hardware block diagrams. Microchip's PICDEM Mechatronics board is used to detail the examples throughout the book.

* Focuses on the C programming language which is by far the most popular for microcontrollers (MCUs)
* Features Proteus VSMg the most complete microcontroller simulator on the market, along with CCS PCM C compiler, both are highly compatible with Microchip tools
* Extensive downloadable content including fully worked examples
Click here to download Programming 8-bit PIC Microcontrollers in C: with Interactive Hardware Simulation

Password : www.freebookspot.com

Introduction to Microcontrollers: Architecture, Programming, and Interfacing for the Motorola 68HC12

Provides a comprehensive introductory text/ reference for electrical and computer engineers, students and even hobbyists who have little experience in high-level programming language. Discusses how a typical microcontroller executes assembler language instruction and addresses models on microprocessors.
Introduction to Microcontrollers is a comprehensive introductory text/reference for electrical and computer engineers, students, and even hobbyists who have little experience in a high-level programming language. The book helps them understand how a typical microcontroller executes assembly language instructions and addressing modes on microprocessors. The book shows how to program with C++ and compile assembly language statements. The book utilizes the new 16-bit microcontroller, the Motorola 68Hc12, as the primary example. This "chip" replaces the very popular 8-bit microcontroller, the 68Hc11, as the leading microprocessor for a wide variety of applications and as a core tool for teaching engineering students. This new microcontroller is expected to be popular in industry because of its low cost per unit, low power consumption, and high processing speed.

* First introductory level book on the Motorola 68HC12
* Teaches engineers how a computer executes instructions
* Shows how a high-level programming language converts to assembly language
* Teaches the reader how a microcontroller is interfaced to the outside world
* Uses hundreds of examples throughout the text
* Over 200 homework problems give the reader in-depth practice
* A CD-ROM with HiWare's professional C++ compiler is included with the book
* A complete summary chapter on other available microcontrollers


Click here to Download Introduction to Microcontrollers: Architecture, Programming, and Interfacing for the Motorola 68HC12

Password : www.freebookspot.com

Sunday, May 24, 2009

SCADA (Hardware and Software)

SCADA hardware

A SCADA system consists of a number of remote terminal units (RTUs) collecting field data and sending that data back to a master station, via a communication system. The master station displays the acquired data and allows the operator to perform remote control tasks.

The accurate and timely data allows for optimization of the plant operation and process. Other benefits include more efficient, reliable and most importantly, safer operations. This results in a lower cost of operation compared to earlier non-automated systems.

On a more complex SCADA system there are essentially five levels or hierarchies:
• Field level instrumentation and control devices
• Marshalling terminals and RTUs
• Communications system
• The master station(s)
• The commercial data processing department computer system

The RTU provides an interface to the field analog and digital sensors situated at each remote site.

The communications system provides the pathway for communication between the master station and the remote sites. This communication system can be wire, fiber optic, radio, telephone line, microwave and possibly even satellite. Specific protocols and error detection philosophies are used for efficient and optimum transfer of data.

The master station (or sub-masters) gather data from the various RTUs and generally provide an operator interface for display of information and control of the remote sites. In large telemetry systems, sub-master sites gather information from remote sites and act as a relay back to the control master station.

SCADA software

SCADA software can be divided into two types, proprietary or open. Companies develop proprietary software to communicate to their hardware. These systems are sold as ‘turn key’ solutions. The main problem with this system is the overwhelming reliance on the supplier of the system. Open software systems have gained popularity because of the interoperability they bring to the system. Interoperability is the ability to mix different manufacturers’ equipment on the same system.

Citect and WonderWare are just two of the open software packages available in the market for SCADA systems. Some packages are now including asset management integrated within the SCADA system. The typical components of a SCADA system are indicated in the next diagram.


Key features of SCADA software are:
• User interface
• Graphics displays
• Alarms
• Trends
• RTU (and PLC) interface
• Scalability
• Access to data
• Database
• Networking
• Fault tolerance and redundancy
• Client/server distributed processing

Introduction And Brief History of SCADA

This manual is designed to provide a thorough understanding of the fundamental concepts and the practical issues of SCADA systems. Particular emphasis has been placed on the practical aspects of SCADA systems with a view to the future. Formulae and details that can be found in specialized manufacturer manuals have been purposely omitted in favor of concepts and definitions.

This information provides an introduction to the fundamental principles and terminology used in the field of SCADA. It is a summary of the main subjects to be covered throughout the manual.

SCADA (supervisory control and data acquisition) has been around as long as there have been control systems. The first ‘SCADA’ systems utilized data acquisition by means of panels of meters, lights and strip chart recorders. The operator manually operating various control knobs exercised supervisory control. These devices were and still are used to do supervisory control and data acquisition on plants, factories and power generating facilities. The following figure shows a sensor to panel system.


The sensor to panel type of SCADA system has the following advantages:
  • It is simple, no CPUs, RAM, ROM or software programming needed
  • The sensors are connected directly to the meters, switches and lights on the panel
  • It could be (in most circumstances) easy and cheap to add a simple device like a switch or indicator

The disadvantages of a direct panel to sensor system are:
  • The amount of wire becomes unmanageable after the installation of hundreds of sensors
  • The quantity and type of data are minimal and rudimentary
  • Installation of additional sensors becomes progressively harder as the system grows
  • Re-configuration of the system becomes extremely difficult
  • Simulation using real data is not possible
  • Storage of data is minimal and difficult to manage
  • No off site monitoring of data or alarms
  • Someone has to watch the dials and meters 24 hours a day

Fundamental principles of modern SCADA systems

In modern manufacturing and industrial processes, mining industries, public and private utilities, leisure and security industries telemetry is often needed to connect equipment and systems separated by large distances. This can range from a few meters to thousands of kilometers. Telemetry is used to send commands, programs and receives monitoring information from these remote locations.

SCADA refers to the combination of telemetry and data acquisition. SCADA encompasses the collecting of the information, transferring it back to the central site, carrying out any necessary analysis and control and then displaying that information on a number of operator screens or displays. The required control actions are then conveyed back to the process.

In the early days of data acquisition, relay logic was used to control production and plant systems. With the advent of the CPU and other electronic devices, manufacturers incorporated digital electronics into relay logic equipment. The PLC or programmable logic controller is still one of the most widely used control systems in industry. As need to monitor and control more devices in the plant grew, the PLCs were distributed and the systems became more intelligent and smaller in size. PLCs and DCS (distributed control systems) are used as shown below.


The advantages of the PLC / DCS SCADA system are:
  • The computer can record and store a very large amount of data
  • The data can be displayed in any way the user requires
  • Thousands of sensors over a wide area can be connected to the system
  • The operator can incorporate real data simulations into the system
  • Many types of data can be collected from the RTUs
  • The data can be viewed from anywhere, not just on site

The disadvantages are:
  • The system is more complicated than the sensor to panel type
  • Different operating skills are required, such as system analysts and programmer
  • With thousands of sensors there is still a lot of wire to deal with
  • The operator can see only as far as the PLC

As the requirement for smaller and smarter systems grew, sensors were designed with the intelligence of PLCs and DCSs. These devices are known as IEDs (intelligent electronic devices). The IEDs are connected on a fieldbus, such as Profibus, Devicenet or Foundation Fieldbus to the PC. They include enough intelligence to acquire data, communicate to other devices, and hold their part of the overall program. Each of these super smart sensors can have more than one sensor on-board. Typically, an IED could combine an analog input sensor, analog output, PID control, communication system and program memory in one device.


The advantages of the PC to IED fieldbus system are:
  • Minimal wiring is needed
  • The operator can see down to the sensor level
  • The data received from the device can include information such as serial numbers, model numbers, when it was installed and by whom
  • All devices are plug and play, so installation and replacement is easy
  • Smaller devices means less physical space for the data acquisition system

The disadvantages of a PC to IED system are:
  • More sophisticated system requires better trained employees
  • Sensor prices are higher (but this is offset somewhat by the lack of PLCs)
  • The IEDs rely more on the communication system

Saturday, May 23, 2009

Alignment Grid & Pull-Down Menus in LabVIEW

Alignment Grid

you probably noticed the grid lines on the VI's front panel and how the waveform chart and stop controls "snap" to the grid lines as you move them around with the mouse. This feature is very useful for keeping your front panel objects aligned. If you do not like this feature, you can turn it off in the LabVIEW Options dialog. (Figures 30 and 31 show a VI front panel with the alignment grid feature turned ON and OFF, respectively.) Open the options dialog by selecting Tools, Options. . . from the menu. Navigate to the Alignment Grid category. From here, you can choose to show or hide the grid lines and to enable or disable grid alignment. If you are not sure of your preference, leave the alignment grid onyou'll probably like it.


Figure 30. VI with alignment grid option ON


Figure 31. VI with alignment grid option OFF

Pull-Down Menus

Keep in mind that LabVIEW's capabilities are many and varied. This tutorial by no means provides an exhaustive list of all of LabVIEW's ins and outs (it would be several thousand pages long if that were the case); instead, we try to get you up to speed comfortably and give you an overview of what you can do. If you want to know everything there is to know about a subject, we'd recommend looking it up in one of LabVIEW's many manuals, attending a seminar, or going to ni.com/labview on the Web. Feel free to skim through this section and some of the subsequent ones, but remember that they're here if you need a reference.

LabVIEW has two main types of menus: pull-down and pop-up. You used some of them in the last activity, and you will use both extensively in all of your program development henceforth. Now you will learn more about what they can do. We'll cover pull-down menu items very briefly in this section. You might find it helpful to look through the menus on your computer as we explain them, and maybe experiment a little.

The menu bar at the top of a VI window contains several pull-down menus (in Mac OS X, the menu bar will be at the top of the screen, consistent with other Mac OS X applications). When you click on a menu bar item, a menu appears below the bar. The pull-down menus contain items common to many applications, such as Open, Save, Copy, and Paste, and many other functions particular to LabVIEW. We'll discuss some basic pull-down menu functions here. You'll learn more about the advanced capabilities later.

Many menus also list shortcut keyboard combinations for you to use if you choose. To use keyboard shortcuts, press the appropriate key in conjunction with the control key on PCs, the command key on Macs, and the meta key on Linux.

File Menu

Pull down the File menu , which contains commands common to many applications, such as Save and Print. You can also create new VIs or open existing ones from the File menu. In addition, you can show VI Properties information and development history from this menu.


Edit Menu

Take a look at the Edit menu (see Figure 33). It has some universal commands, like Undo, Cut, Copy, and Paste, that let you edit your window. You can also search for objects with the Find and Replace . . . command and remove bad wires from the block diagram.


Figure 33. Edit menu

View Menu

In the View menu (see Figure 34), you will see options for opening the Controls Palette, Functions Palette, and Tools Palette if you've closed them. You can also show the error list and see a VI's hierarchy. The Browse Relationships submenu contains features to simplify navigation among large sets of VIs, such as determining all of a VI's subVIs and where a VI is used as a subVI.


Project Menu

The Project menu (see Figure 35) allows you to open a LabVIEW project or create a new project, as well as operate on the project to which the active VI belongs. If the active VI does not belong to any LabVIEW project, only the Open Project and New Project menu items will be enabled.


Operate Menu

You can run or stop your program from the Operate menu (see Figure 36), although you'll usually use Toolbar buttons. You can also change a VI's default values, control "print and log at completion" features, and switch between run mode and edit mode.


Figure 36. Operate menu

Tools Menu

The Tools menu (see Figure 37) lets you access built-in and add-on tools and utilities that work with LabVIEW, such as the Measurement & Automation Explorer, where you configure your DAQ devices, or the Web Publishing Tool for creating HTML pages from LabVIEW. You can view and change the myriad of LabVIEW's Options


Figure 37. Tools menu

Window Menu

Pull down the Window menu (see Figure 38). Here you can toggle between the front panel and block diagram windows, "tile" both windows so you can see them at the same time, and switch between open VIs.


Figure 38. Window menu

Help Menu

You can show, hide, or lock the contents of the Context Help window using the Help menu (see Figure 39). You can also access LabVIEW's online reference information and view the About LabVIEW information window.


Figure 39. Help menu

PIC Microcontrollers, Second Edition: An Introduction to Microelectronics

A comprehensive, highly illustrated introduction to microelectronic systems and the PIC microcontroller.

Product Description
The use of microcontroller based solutions to everyday design problems in electronics, is the most important development in the field since the introduction of the microprocessor itself. The PIC family is established as the number one microcontroller at an introductory level.

Assuming no prior knowledge of microprocessors, Martin Bates provides a comprehensive introduction to microprocessor systems and applications covering all the basic principles of microelectronics.

Using the latest Windows development software MPLAB, the author goes on to introduce microelectronic systems through the most popular PIC devices currently used for project work, both in schools and colleges, as well as undergraduate university courses. Students of introductory level microelectronics, including microprocessor / microcontroller systems courses, introductory embedded systems design and control electronics, will find this highly illustrated text covers all their requirements for working with the PIC.

Part A covers the essential principles, concentrating on a systems approach. The PIC itself is covered in Part B, step by step, leading to demonstration programmes using labels, subroutines, timer and interrupts. Part C then shows how applications may be developed using the latest Windows software, and some hardware prototyping methods.

The new edition is suitable for a range of students and PIC enthusiasts, from beginner to first and second year undergraduate level. In the UK, the book is of specific relevance to AVCE, as well as BTEC National and Higher National programmes in electronic engineering.

* A comprehensive introductory text in microelectronic systems, written round the leading chip for project work
* Uses the latest Windows development software, MPLAB, and the most popular types of PIC, for accessible and low-cost practical work
* Focuses on the 16F84 as the starting point for introducing the basic architecture of the PIC, but also covers newer chips in the 16F8X range, and 8-pin mini-PICs

Password : www.freebookspot.com

Practical Aspects of Embedded System Design using Microcontrollers

Second in the series, Practical Aspects of Embedded System Design using Microcontrollers emphasizes the same philosophy of "Learning by Doing" and "Hands on Approach" with the application oriented case studies developed around the PIC16F877 and AT 89S52, today's most popular microcontrollers. Readers with an academic and theoretical understanding of embedded microcontroller systems are introduced to the practical and industry oriented Embedded System design. When kick starting a project in the laboratory a reader will be able to benefit experimenting with the ready made designs and 'C' programs. One can also go about carving a big dream project by treating the designs and programs presented in this book as building blocks. Practical Aspects of Embedded System Design using Microcontrollers is yet another valuable addition and guides the developers to achieve shorter product development times with the use of microcontrollers in the days of increased software complexity.

Going through the text and experimenting with the programs in a laboratory will definitely empower the potential reader, having more or less programming or electronics experience, to build embedded systems using microcontrollers around the home, office, store, etc. Practical Aspects of Embedded System Design using Microcontrollers will serve as a good reference for the academic community as well as industry professionals and overcome the fear of the newbies in this field of immense global importance.

About the Author

The proposed book will complement Springer's rich collection of books on embedded systems and especially the book "Exploring C for Microcontrollers - A Hands on Approach" authored by the same group in 2007

Password : www.freebookspot.com

Friday, May 22, 2009

Autorange Capacitance Meter with PIC16F873A

Finally, I managed to persuade myself to make a really powerful capacitance meter. This is an autoranged version, which means one does not need to adjust the range settings. Furthermore, the measuring range is quite large, from 5pF all the way to 2600uF. It is all taken care of by the PIC16F873A inside the circuit.

It is based on a very simple circuit analysis principle of charging and discharging of capacitors in an RC circuit.


Tau = RC, where Tau is the Time constant of any given RC circuit. The voltage at any time t across the capacitor is given as,

Vcap = E[1 - e^ (t/RC)]

Substituting t with Tau = RC,
Vcap = 0.632E or 63.2 % of the charging voltage, for 5V it will be about 3.16V. This will be the reference voltage for the comparator module on board the PIC16F873A.

The other input to the comparator is the actual capacitor's voltage itself.


The capacitance meter begins by discharging the capacitor fully. Then it charges it and waits until the voltage across the capacitor reaches 0.632Vcc. The time is then captured and the capacitance is computed using Tau = RC. A 16 bit division routine written by Andy Warren is used for this project. The result is then displayed on the LCD. The process will then repeat itself every subsequent 0.255s.

The initial tests on the breadboard indicated some small problems. It appears that even the breadboard itself contains stray capacitance which may greatly affect readings, especially the readings on less then 100pF ranges.

To correct for this problem, I implemented 2 push buttons that can help calibrate the capacitance meter. Calibration is a simple task of just pushing the buttons until the capacitance reading reads 00000.00pF when there is not capacitors connected. Also, to prevent calibration at every time the meter is used, I also implemented a button to save the calibration settings on the EEPROM of the PIC16F873A. The PIC loads the setting everytime the device gets powered on.

Basic Electricity and Electronics for Control: Fundamentals and Applications, 3rd Edition

This class-tested book gives you a familiarity with electricity and electronics as used in the modern world of measurement and control. Integral to the text are procedures performed to make safe and successful measurements of electrical quantities. It will give you a measurement vocabulary along with an understanding of digital and analog meters, bridges, power supplies, solid state circuitry, oscilloscopes, and analog to digital conversions. This book is about behavior, not design, and thus lends itself to an easy-to-understand format over absolute technical perfection. And where possible, applications are used to illustrate the topics being explained.

The text uses a minimum of mathematics and where algebraic concepts are utilized there is sufficient explanation of the operation, so you may see the solution without actually performing the mathematical operations.

This book is student centered. It has been developed from course materials successfully used by the author in both a college setting and when presented as short course study classes by ISA. These materials have been successful because of the insistence on practicality and solicitation of student suggestions for improvements. Basic Electricity and Electronics for Control will enhance student success in any industrial or technical school setting where basic technician training is to take place.

Op Amps for Everyone

The op amp IC has become the universal analog IC because it can perform all analog tasks. OP AMPS FOR EVERYONE provides the theoretical tools and practical know-how to get the most from these versatile devices. This new edition substantially updates coverage for low-speed and high-speed applications, and provides step by step walkthroughs for design and selection of op amps and circuits.

* Modular organization allows readers, based on their own background and level of experience, to start at any chapter
* written by experts at Texas Instruments and based on real op amps and circuit designs from TI
* NEW: large number of new cases for single supply op amp design techniques, including use of web-based design tool
* NEW: complete design walk-through for low-speed precision op amp selection and circuit design
* NEW: updates, including new techniques, for design for high-speed, low distortion applications.
* NEW: extensive new material on filters and filter design, including high-speed filtering for video and data

Thursday, May 21, 2009

Super Converter

Super Converter is an application for measurement units conversion. This software easily converts various measurement values into any other possible ones. Inches to centimetres, pounds to kilograms, Fahrenheit to Celsius... and more than 30 other conversions, grouped according to categories. Super Converter also calculates the values of many mathematical functions, as well as makes it possible to conduct geometric constructions and calculations for some figures.

This software tool is suitable fo any engineer. The list of the measurement unit conversion are covered Density, Distance/Length, Drill/Tap, Electrical, Exponents, Flow, Formulas, Force, Force per unit length, Fractions, Geometry, Heat, Light, Mass Per Unit Area, Mass Per Unit Length, Numbers, Power, Pressure, Resistors, Radiation, Temperature, Time, Torque, Velocity, Viscosity, Volume, Weight/Mass, Windchill, Wire Gage, Work, Acceleration, Angular Distance, Angular Velocity, Area, Concentration, Data Storage, Data Transfer.

CodeVisionAVR

CodeVisionAVR is a C cross-compiler, Integrated Development Environment and Automatic Program Generator designed for the Atmel AVR family of microcontrollers. The program is a native 32bit application that runs under the Windows 95, 98, NT 4.0, 2000 and XP operating systems. The C cross-compiler implements nearly all the elements of the ANSI C language, as allowed by the AVR architecture, with some features added to take advantage of specificity of the AVR architecture and the embedded system needs. The compiled COFF object files can be C source level debugged, with variable watching, using the Atmel AVR Studio debugger version 3.50 or later.  

The Integrated Development Environment (IDE) has built-in AVR Chip In-System Programmer software that enables the automatical transfer of the program to the microcontroller chip after successful compilation/assembly.The In-System Programmer software is designed to work in conjunction with the Atmel STK500, Kanda Systems STK200+/300, Dontronics DT006, Vogel Elektronik VTEC-ISP and MicroTronics ATCPU, Mega2000 development boards.

Sunday, May 17, 2009

LabVIEW - Getting Started

1. Launch LabVIEW (if it's been open, you can quit it first).

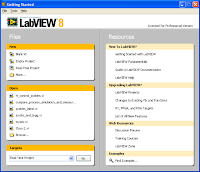
2. At the LabVIEW Getting Started dialog, click Blank VI to create a new blank VI (the Blank VI option is found under the New heading, and you have to click on the "Blank VI" text, not the icon). An "Untitled 1" VI front panel will appear on your screen.

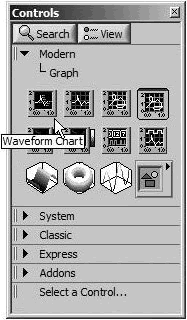
Go to the floating Controls palette and navigate (by clicking) to the Modern Graph, subpalette, shown in Figure 17. If the Controls palette isn't visible, select View Controls Palette from the menu to make it visible. Also, make sure the front panel window is active, or you will see the Functions palette instead of the Controls palette.


Figure 17. Modern Graph palette showing the Waveform 
Chart and various other charts and graphs

On the Graph subpalette, select Waveform Chart by clicking it with the mouse button.


You will notice that, as you run the cursor over the icons in the Controls palette and subpalettes, the selected button or icon's name appears in a tip strip, as shown in Figure 17.


Positioning Tool

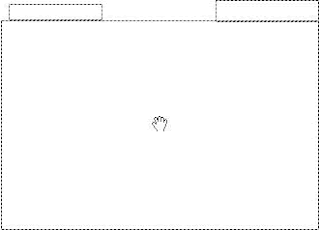
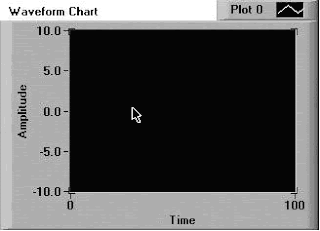
You will see the outline of a chart with the cursor "holding" it, as shown in Figure 18. Position the cursor in a desirable spot on your front panel and click. The chart magically appears exactly where you placed it, as shown in Figure 3.19. If you want to move it, select the Positioning tool from the Tools palette, and then drag the chart to its new home. If the Tools palette isn't visible, select View , Tools Palette from the menu.


Figure 18. Waveform Chart after it has been 
dragged onto the front panel (and before it has been dropped)


Figure 19. Waveform Chart after it has been dropped onto the front panel


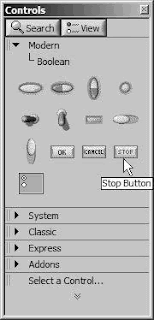
3. Go back to the Modern subpalette; then navigate into Boolean subpalette, and choose Stop Button (see Figure 20).


Figure 20. Modern , Boolean palette showing the 
Stop Button and other Boolean controls and indicators


Place it next to the chart, as shown in Figure 21.


Figure 21. Your VI front panel, after 
adding a Waveform Chart and Stop Button


4. Now change the chart's Y-axis scale range from -10 thru +10 to 0 thru 1. Highlight the number "10" (Y-axis range max) by click-dragging or by double-clicking on it with the Text Edit tool. Now type in 1.0 and click on the enter button that appears in the Toolbar at the top of the window. Change -10 (Y-axis range min) to 0 in a similar manner.


Enter Button

5. Switch to the block diagram by selecting Show Block Diagram from the Window menu. You should see two terminals already there, as shown in Figure 22.


Figure 22. Your VI block diagram, showing the 
Stop Button and Waveform Chart terminal


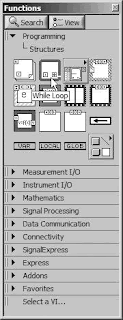
6. Now you will put the terminals inside a While Loop to repeat execution of a segment of your program. Go to the Programming , Structures subpalette of the floating Functions palette and select the While Loop (see Figure 23). Make sure the block diagram window is active, or you will see the Controls palette instead of the Functions palette.


Figure 23. Programming , Structures palette showing 
a While Loop and other LabVIEW structure


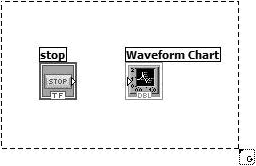
Your cursor will change to a little loop icon. Now enclose the DBL and TF terminals: Click and hold down the mouse button while you drag the cursor from the upper-left to the lower-right corners of the objects you wish to enclose (see Figure 24).


Figure 24. Dragging the mouse cursor around a region of code


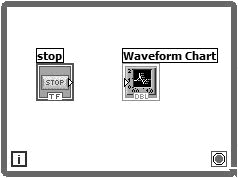
When you release the mouse button, the dashed line that is drawn as you drag will change into the While Loop border (see Figure 25). Make sure to leave some extra room inside the loop.


Figure 25. A While Loop containing the code 
that was enclosed by the dragged region


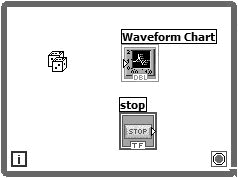
7. Go to the Functions palette and select Random Number (0-1) from the Programming , Numeric subpalette. Place it inside the While Loop.

8. With the Positioning tool active, arrange your diagram objects so that they look like the block diagram in Figure 26.


Positioning Tool


Figure 26. Your block diagram after 
placing the Random Number (0-1) function

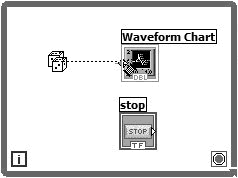
9. With the Wiring tool active, click once on the Random Number (0-1) icon, drag the mouse over to the Waveform Chart's terminal, and click again (see Figure 27).


Figure 27. Your block diagram, as you 
drag a wire from the Random Number (0-1) 
function to the Waveform Chart terminal.


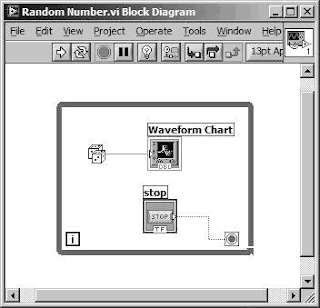
You should now have a solid orange wire connecting the two icons, as shown in Figure 28. If you mess up, you can select the wire or wire fragment with the Positioning tool and then hit the key to get rid of it. Now wire the Boolean TF terminal to the conditional terminal of the While Loop. The loop will execute while the switch on the front panel is FALSE (not pressed down) and stop when the switch becomes TRUE (pressed down).


Figure 28. Your block diagram after 
completing the wiring task

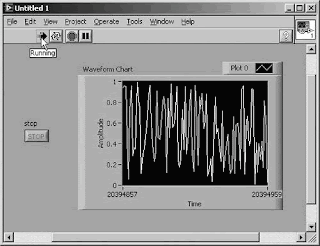
10. You should be about ready to run your VI. First, switch back to the front panel by selecting Show Front Panel from the Window menu. Now click on the run button to run your VI. You will see a series of random numbers plotted continuously across the chart. When you want to stop, click on the stop Boolean button using the Operating tool (see Figure 29).


Figure 29. Your VI front panel 
after pressing the Run button


11. Create a directory or folder called MYWORK in a convenient location (such as your home or documents directory). Save your VI in your MYWORK directory or folder by selecting Save from the File menu and pointing out the proper location to save to. Name it Random Number.vi.